Overview
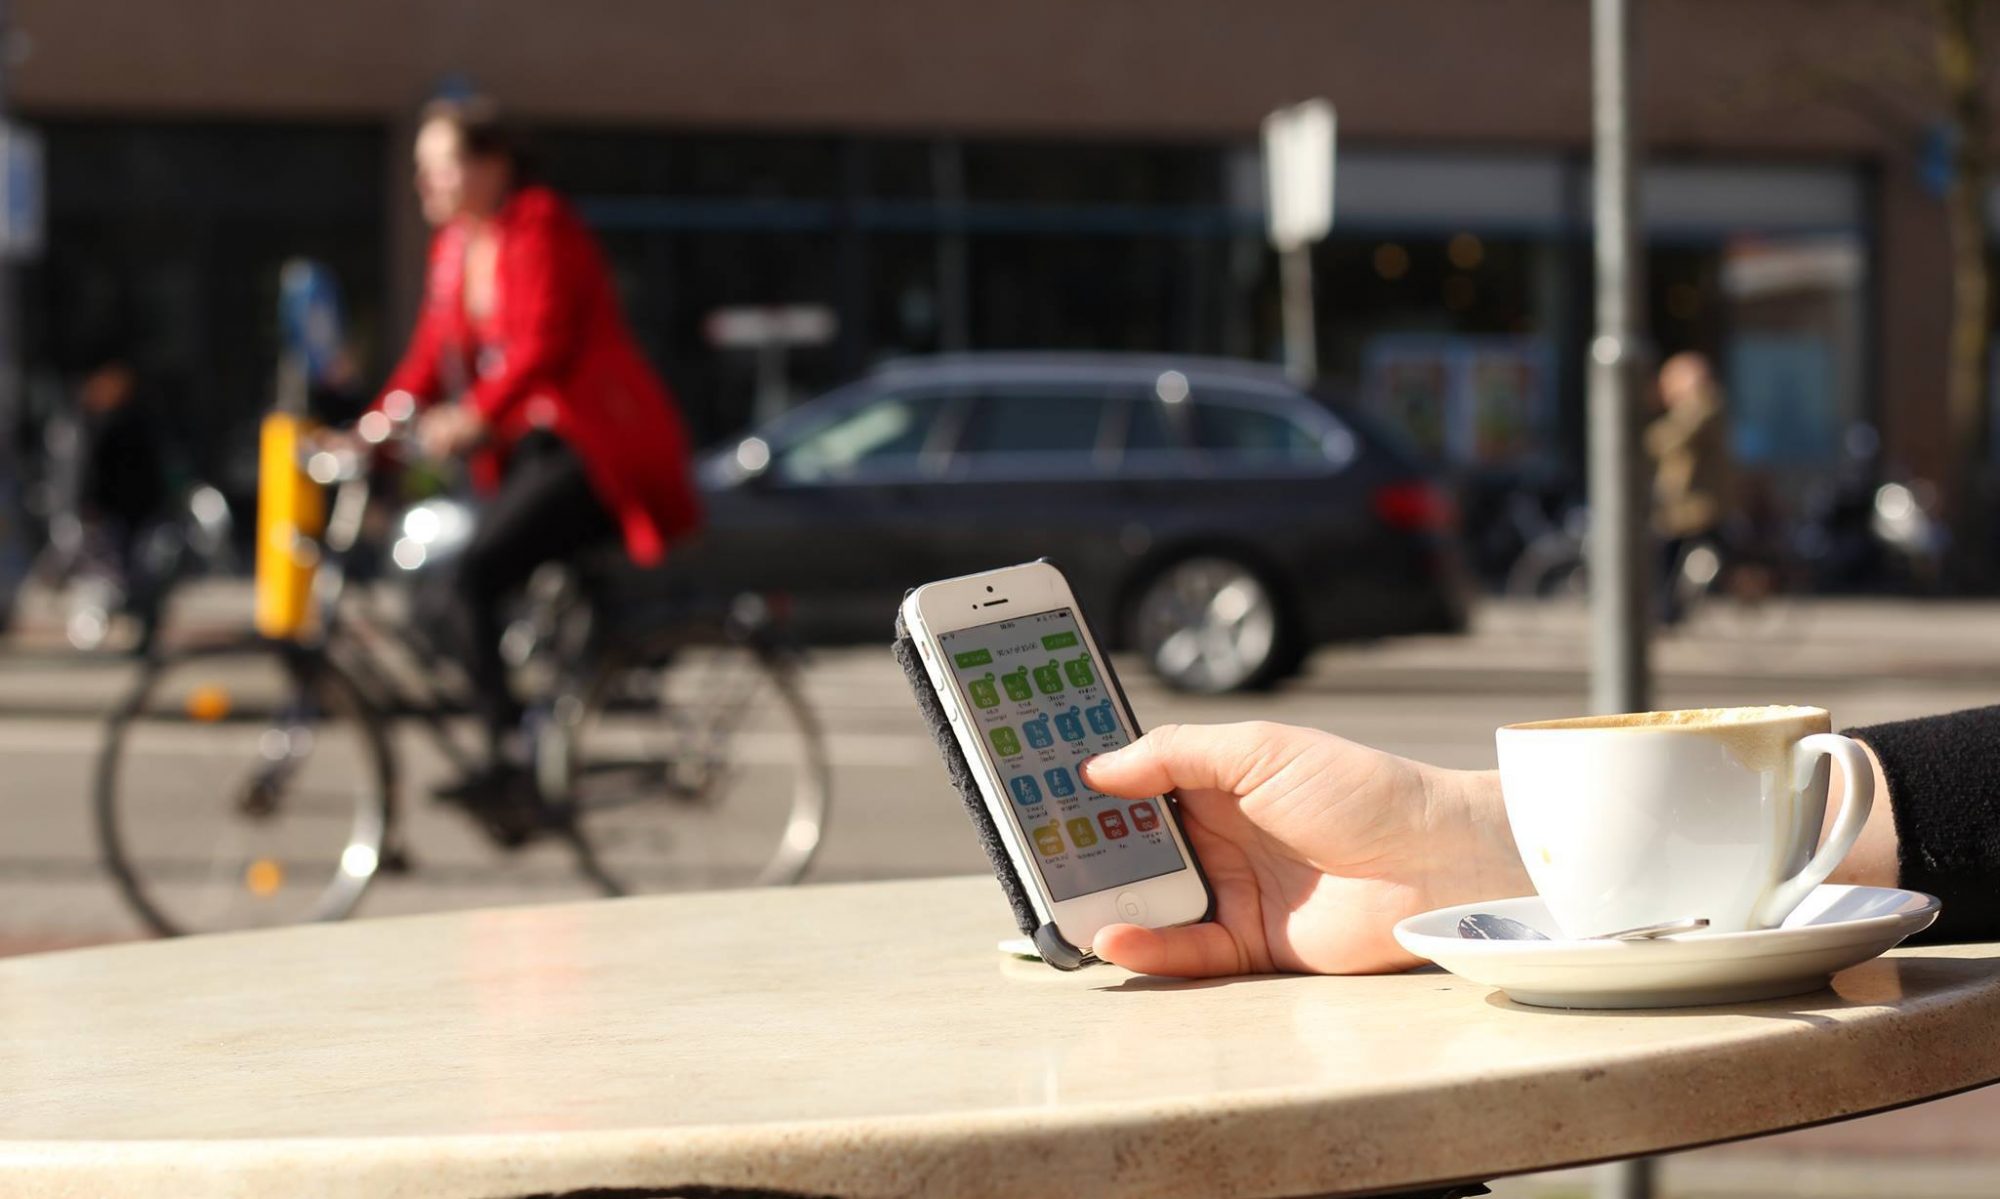
The Demographics count type is the newest count type we have created. This count allows us to observe the perceived demographics of people on bikes, specifically perceived gender, perceived age and perceived ethnic origin.
What do Perceived gender, age, and ethnic origin mean?
All the data collected relies on counters’ perceptions. It’s important to highlight that as counters, you can’t know for certain what gender, age bracket, or ethnic origin a person falls into or identifies with. We know this and it’s OK.
To gather more reliable demographic data, one would have to stop and ask each person, which is both time-consuming and technically infeasible. However, real-time actual data is important, and data collection based on observation of perceived demographics has a long history of use and value. What matters most is consistency.
While we will not be accurate, we do know that people will be inaccurate consistently. That allows us to draw conclusions. Large volumes of data also help uncover patterns. In the end, we get some very important data points that tell a story. And the story has real consequences with tangible outcomes, such as the finding out whether women’s transport needs are being adequately met, or whether elderly people are being offered physical activity options in proportion to their percentage of the population, or whether those in the bike lane reflect the general ethnic makeup of the surrounding community or not.
How can you categorize people on bikes?
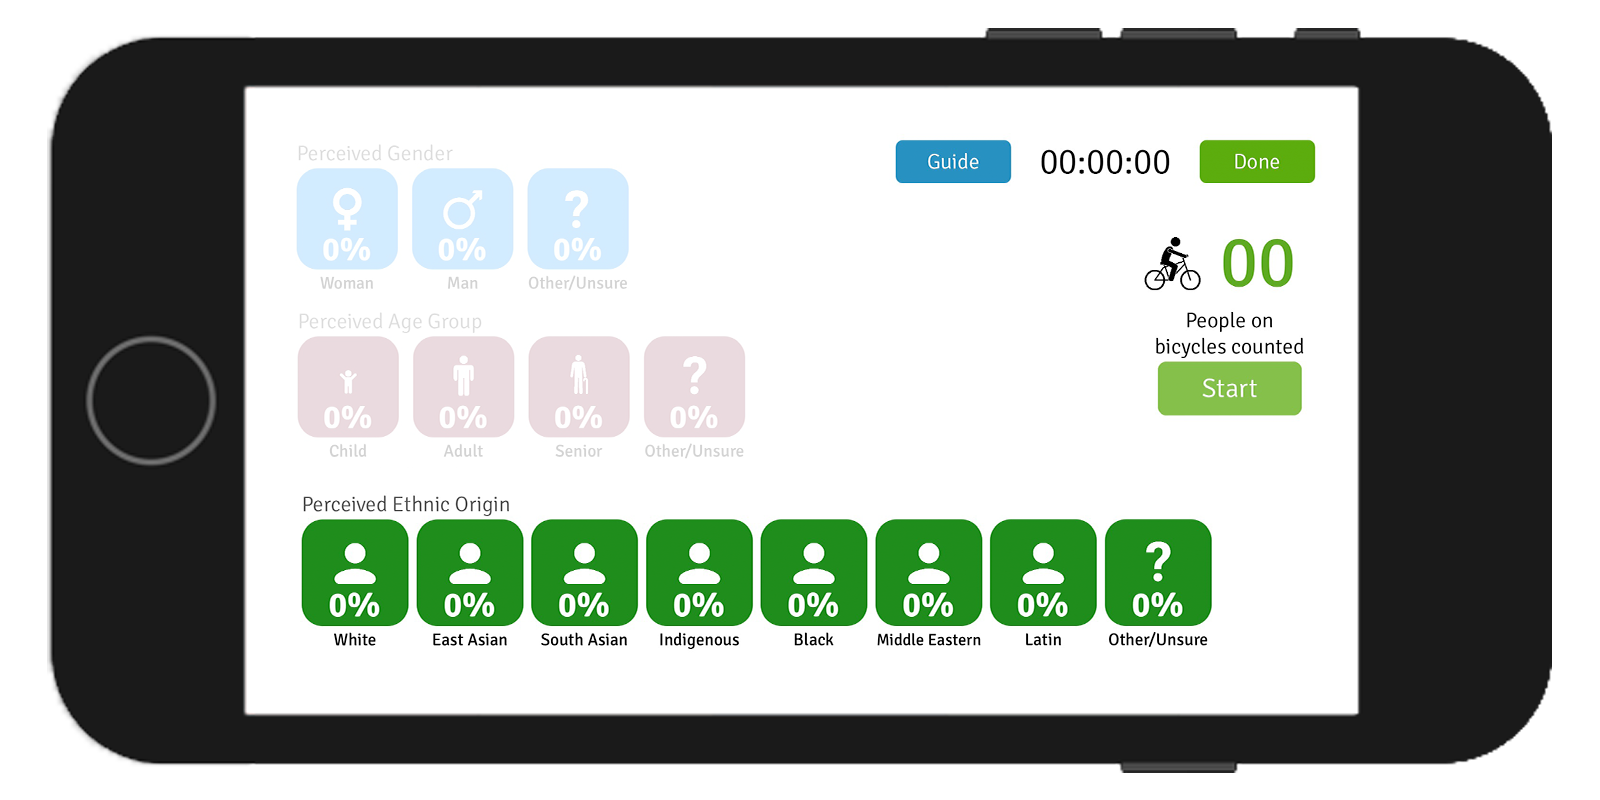
Below you can find definitions that explain the different options you can select from on the count screen. These provide some guidance on how to select categories, using attributes that can be readily observed, such as skin color, hair texture, facial features, and dress.
How did we create and define our categories?
We have relied on various resources to guide us in creating our categories. Some of these resources include:
-
-
- “Count me in! Collecting human rights-based data” created by the The Ontario Human Rights Commission
- “The open public life data protocol.” Founded by the Gehl Institute
- Ontario’s complete standards and guidance for race-based data collection, and
- The Government of Canada’s identification of populations document
-
Review of Count Categories and Descriptions
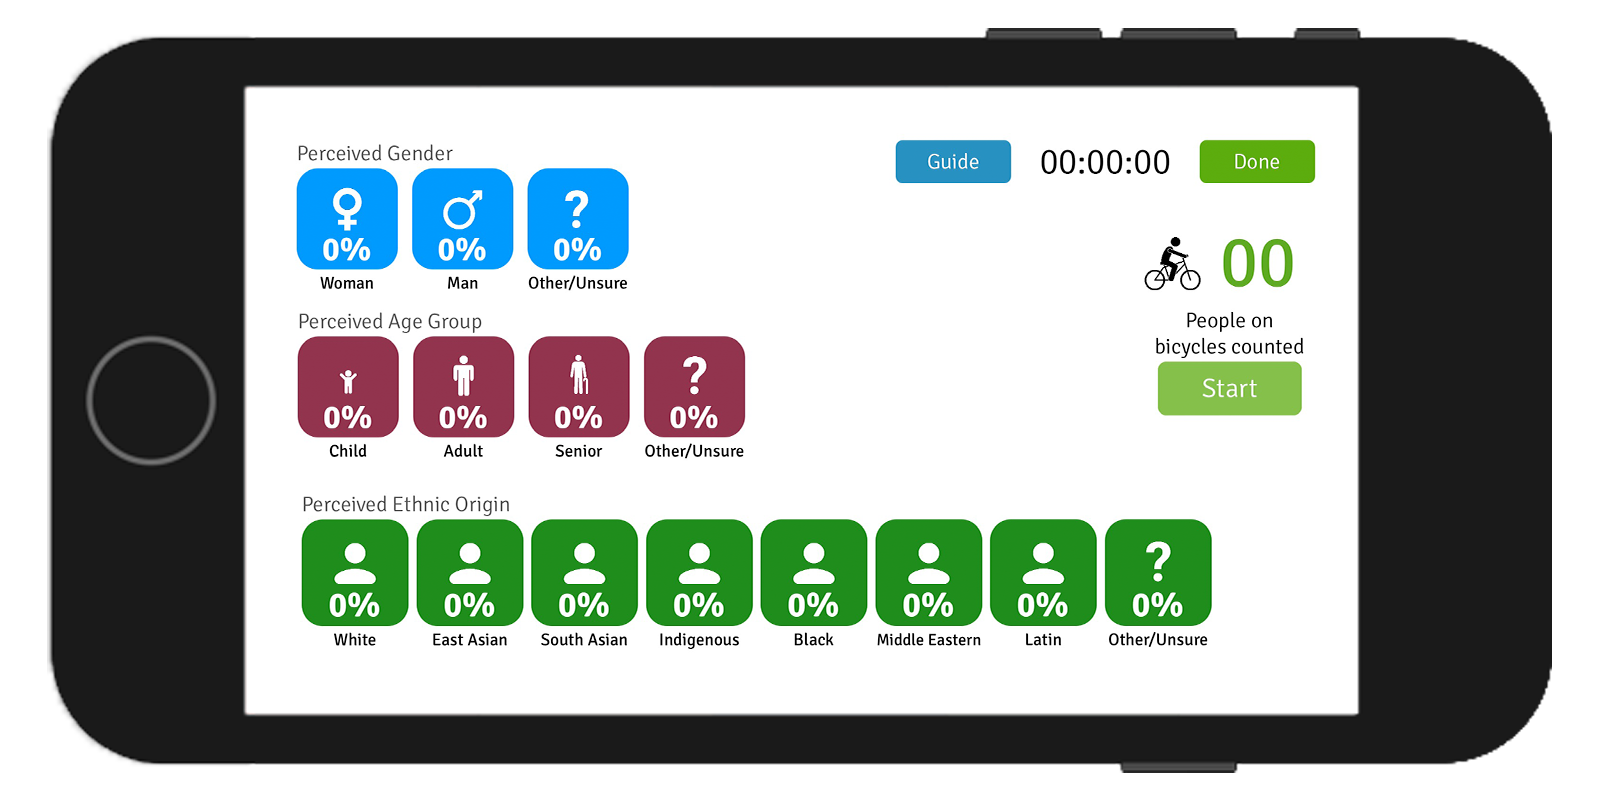
1. Perceived gender
Gender category |
Description |
|
Male |
People who are perceived by surveyors as men or boys. |
|
Female |
People who are perceived by surveyors as women or girls. |
|
Other/Unsure |
People who are perceived by surveyors as non-binary or whom the surveyors do not feel comfortable assuming the gender of. Infants and toddlers may fall in this category. |
Gender is complex, personal and self-identification is an important element of agency. Perceived gender observation can therefore feel uncomfortable because it will rely on you to confront some subtle social cues, perceptions of secondary sex characteristics, and your own biases. Just remember, there are no wrong answers. There are ways of comparing perceived gender and self-identification, allowing for adjustments to the data – but that’s not something you are asked to do. Simply do your best.
The other/unsure represents a button you will want to use if you don’t even have enough info to venture a guess. For example, the person you are counting may go by too quickly or was wearing a scarf hiding that beard you may have been relying on. Toddlers and infants often may fall in this category for most people. It can also be used for someone who may visibly be gender ambiguous and does not fall under either the male or female category. Use your judgment, try your best, and remember that in the end, perceived gender and gender are different but the data you are collecting will nonetheless tell us answers worth knowing.
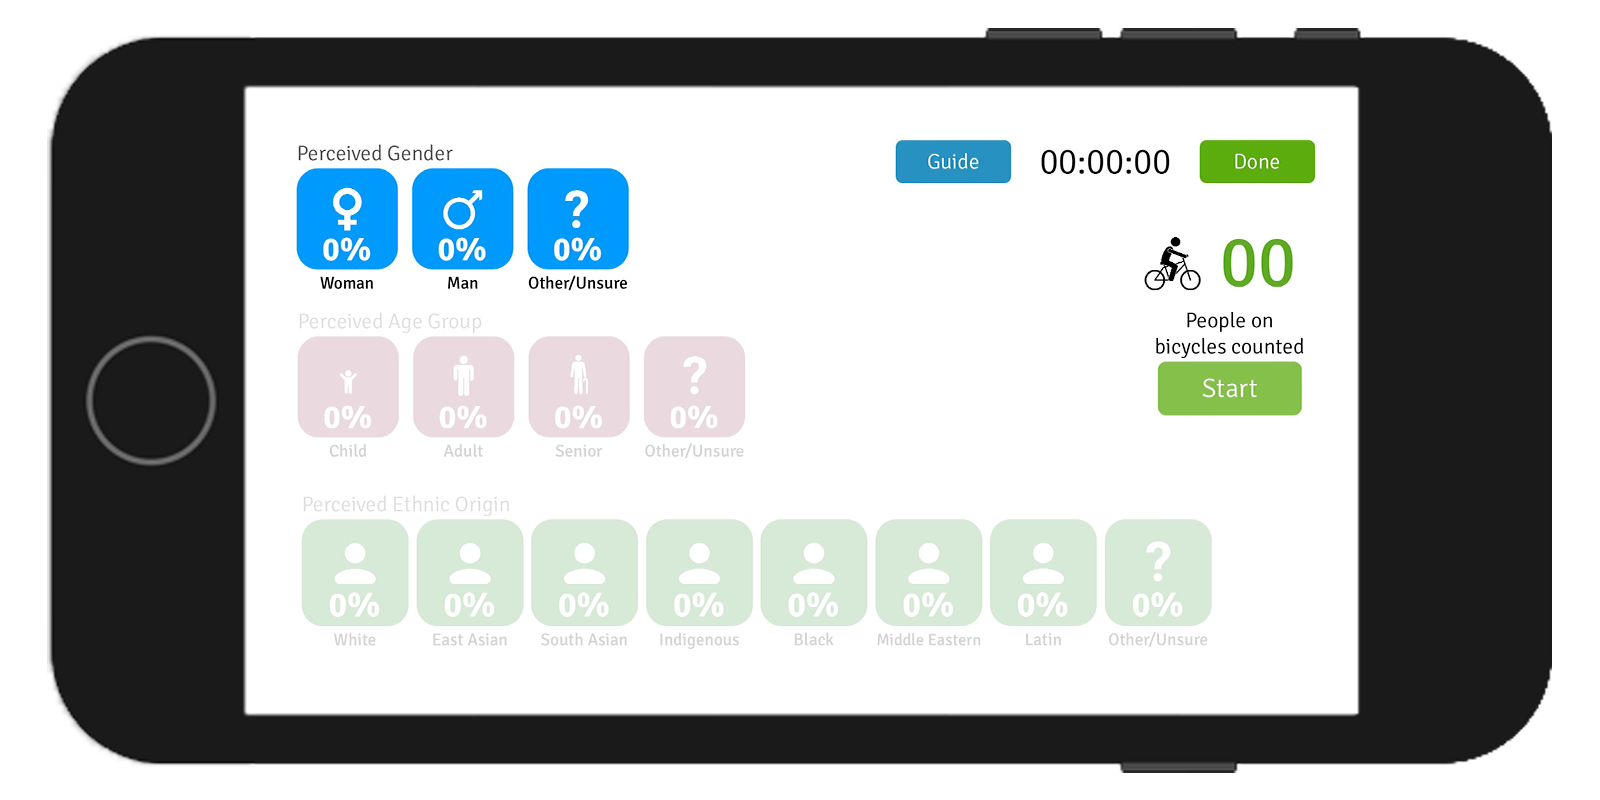
2. Perceived Age
Age category |
Description |
|
Children |
People perceived to be 0-17 years old |
|
Adults |
People perceived to be 18-64 years old |
|
Seniors |
People perceived to be 65+ years old |
|
Other/Unsure |
People whose age you could not perceive (i.e. passed by too fast, etc.) |
3. Perceived Ethnic Origin
Ethnic Origin categories* |
Description/examples |
|
Black |
African, Afro-Caribbean, African-Canadian descent |
|
East/Southeast Asian |
Chinese, Korean, Japanese, Taiwanese descent; Filipino, Vietnamese, Cambodian, Thai, Indonesian, other Southeast Asian descent |
|
Indigenous (First Nations, Métis, Inuk/Inuit) |
First Nations, Métis, Inuit descent |
|
Latino |
Latin American, Hispanic descent |
|
Middle Eastern |
Arab, Persian, West Asian descent, e.g. Afghan, Egyptian, Iranian, Lebanese, Turkish, Kurdish, etc. |
|
South Asian |
South Asian descent, e.g. East Indian, Pakistani, Bangladeshi, Sri Lankan, Indo-Caribbean, etc. |
|
White |
European descent |
|
Other/Unsure** |
Another category |
These groupings were chosen based on existing StatsCan and Ontario’s complete standards and guidance for race-based data collection categories for the sake of comparability. Just like gender and age, we are not looking for the “right” answer, but rather your best guess based on your own knowledge and perception. It may be easy for some, very difficult for others. Ethnicity is of course very fluid within both individuals and groups, the borders that underpin even the most specific definition of ethnicity are human-made, and humanity itself is one big, dynamic and beautiful mix of faces and cultures. Many will find this category even more difficult than age or gender. From our testing, we know that perceived ethnicity will often be the last characteristic you will feel comfortable logging as people approach closer. Facial features and skin tone will often be your only cues, and these are never reliable. Again, however, this data helps. It is well known that systemic racism exists and that Indigenous people, Black people, White people, etc.. experience spaces differently. Your data helps us draw conclusions about whether access to these spaces is racialized and doing it by observation helps us do that in the fastest way possible. Just remember, do your best.