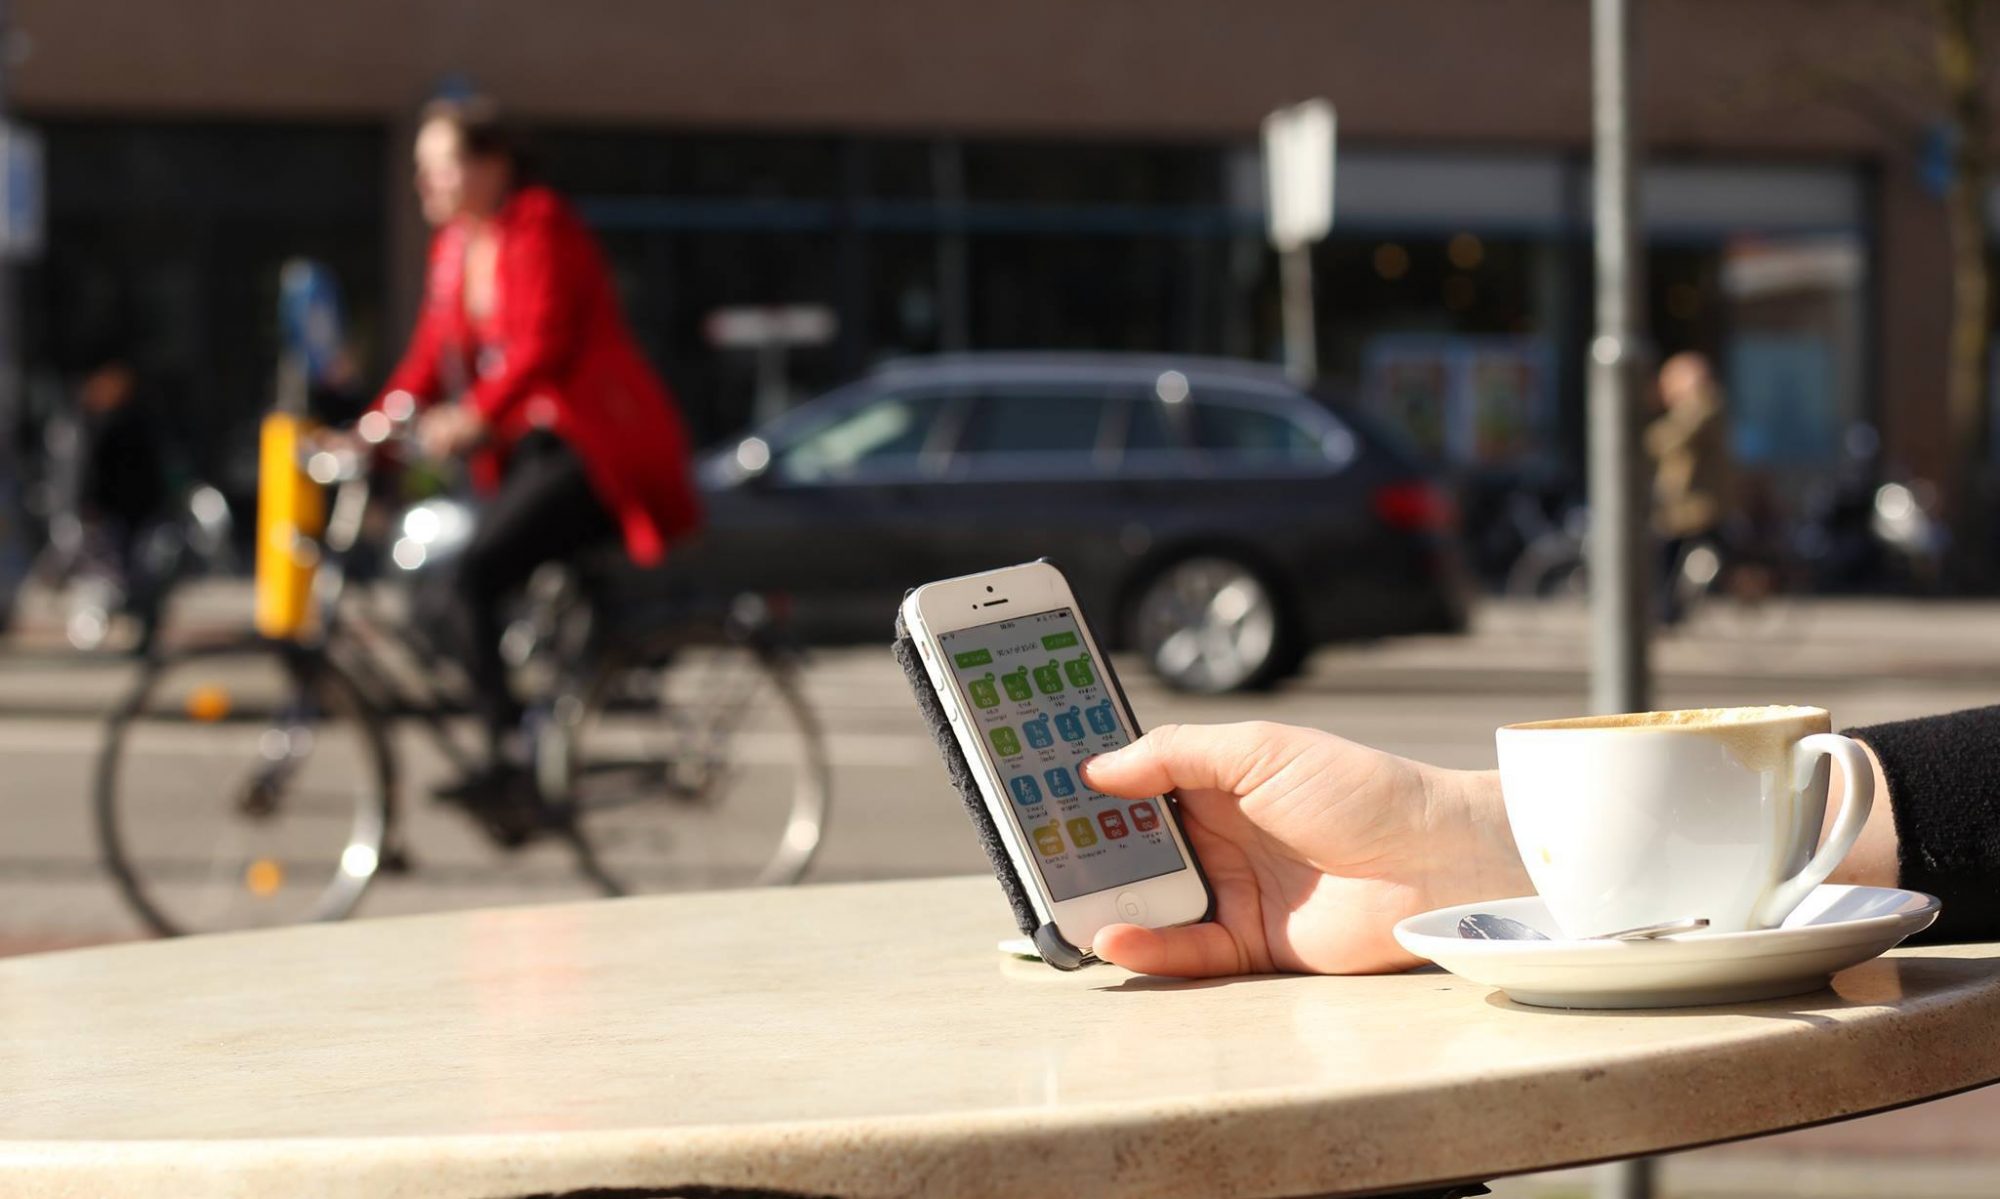
CounterPoint – Where Everyone Counts.
Free open data & crowdsourced app that makes it easy to count all forms of traffic. Prove it.
CounterPoint – Where Everyone Counts.
Free open data & crowdsourced app that makes it easy to count all forms of traffic. Prove it.